Center stage for
Nordic power.
Every dataset, analytic and forecast — one live atlas.
Kraftatlas brings the whole Nordic market onto one stage: prices, generation, hydro, flows and flow-based congestion — with the analytics traders act on, and a daily spread-risk forecast building a public, dated track record.
The Nordic market went flow-based. The data didn't get any friendlier.
The signal that moves Nordic spreads is buried in thousands of constraint rows an hour — and the people who can read it sell it back to you behind a sales call.
Raw & awkward
Flow-based congestion is published as thousands of constraint rows per hour. Useful in theory, unreadable in practice without grid-topology context.
Spreads, not zones
Congestion rent and hedge basis live in the spread between zones. Most tools still hand you zonal prices and leave the math to you.
Gated & unverifiable
The incumbents sell forecasts behind enterprise contracts — and publish no track record. You can't audit a forecast you're never shown.
Every dataset on one stage — plus the forecast.
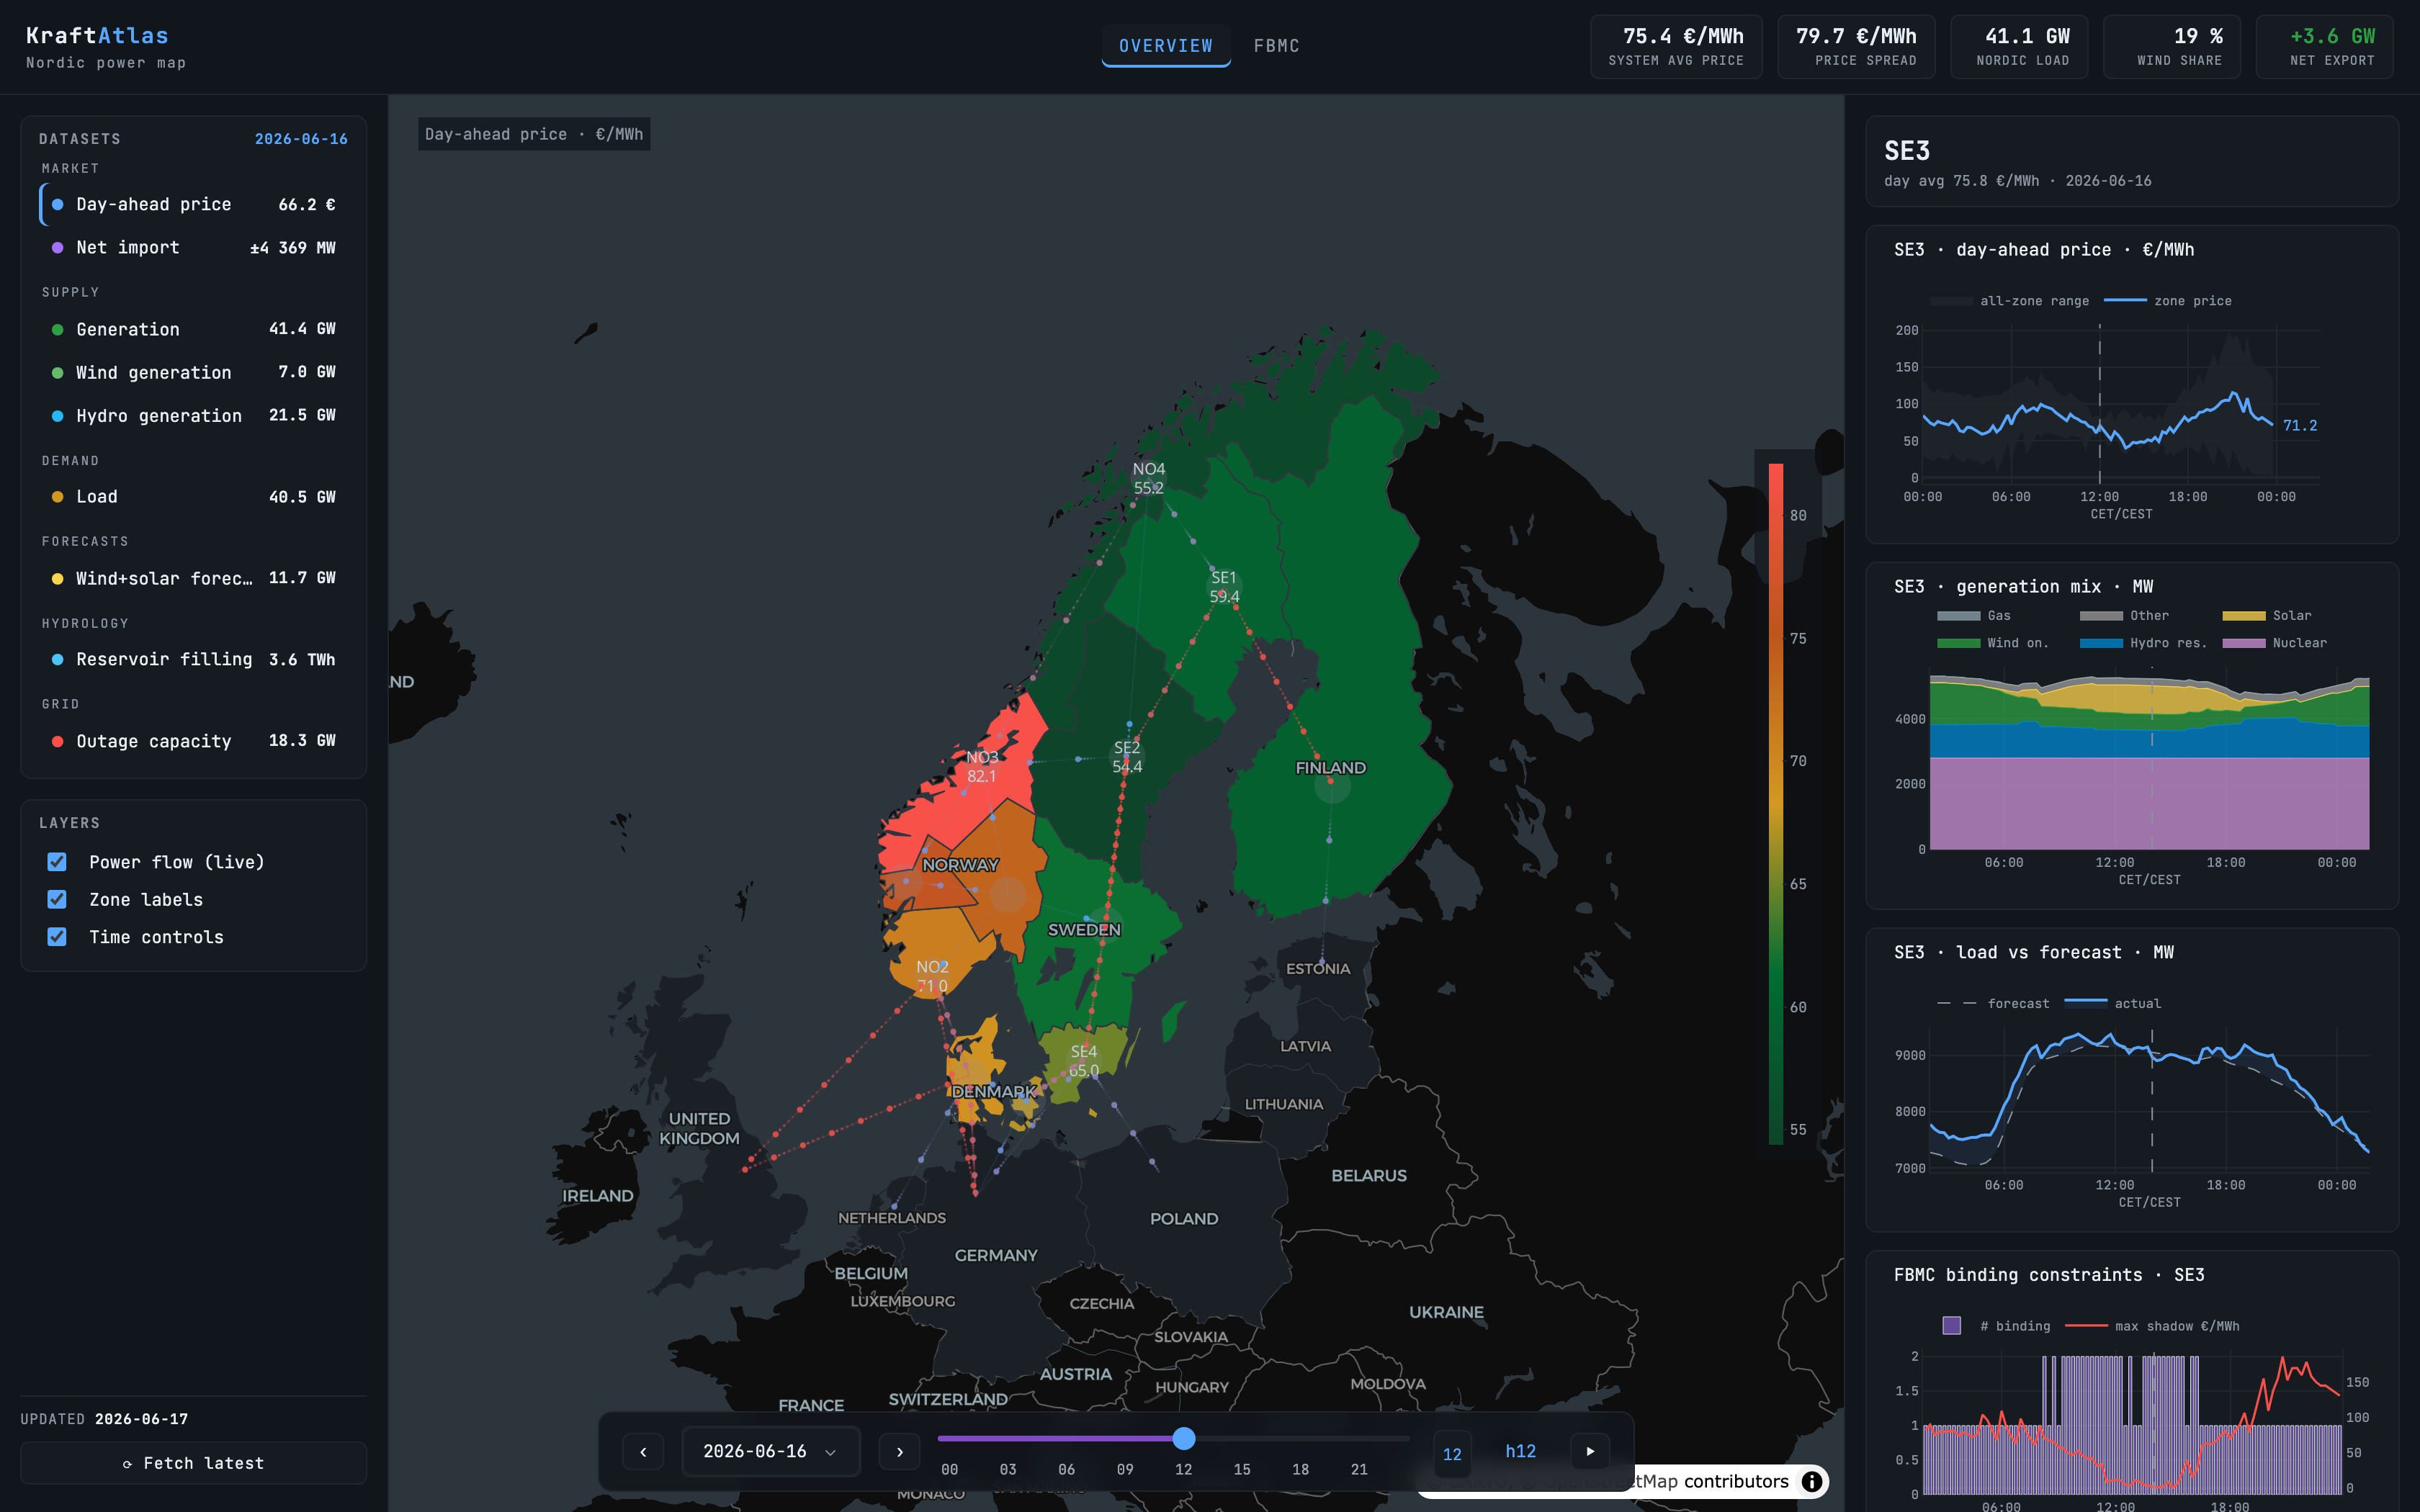
A free, beautiful live map as the front door, with congestion tools you can use today and a spread-risk forecast on the way — the whole Nordic picture in one place.
The live map →
Prices, generation, load, hydro, outages and live flows across all 12 zones — read the whole Nordic situation in seconds.
The flow-based edge →
Network-tightness index, binding-constraint history and a CNEC explorer that links each shadow price back to the map.
The spread forecast Record accruing
Probabilistic, calibrated spread-risk — published daily before gate closure since 17 Jul 2026, scored in the open on a public scoreboard.
From the best public Nordic map to a daily trading habit.
The map + the record
- Full Nordic overview — prices, generation, hydro, flows
- Flow-based module: tightness, binding constraints, CNEC explorer
- Daily spread-risk forecast — published pre-gate, record accruing since 17 Jul 2026
The scoreboard
- Public scoreboard — monthly EPAD fair value vs market vs realized
- Rich / cheap calls per zone — SE3, SE4, FI first
- Opens when the method is ready to be judged permanently — no announced date
The desk tool
- Expanded zone-pair coverage
- CNEC & tightness alerts, intraday views
- API access for short-term desks
Small on purpose. Deep domain.
Kraftatlas is built by a Nordic power data scientist who got tired of the market's best signal being locked behind sales calls. It stays small by design: one pipeline, daily batch, everything published and scored in the open — the tool we wanted but couldn't find.
Data science
From raw ENTSO-E constraint tables to a calibrated, publishable signal — probabilistic models, honest feature engineering, and track-record logging from day one.
Design
Information density without cognitive overload. Trader-grade dashboards where the signal is always one click away — not buried behind menus and export dialogs.
Domain expertise
We understand flow-based mechanics, zone-pair spread dynamics and what actually moves a Nordic book. The tool reflects that context, not just the raw numbers.
Your market knowledge makes this sharper.
If you trade Nordic power, run a portfolio, or work anywhere in the energy market — we genuinely want to hear from you. What's missing from the map? What would make your morning faster? Which constraint matters most and isn't shown?
We're open to suggestions, collaborations and direct market feedback from power traders, analysts, quants and grid experts. No agenda — just better data for everyone who needs it.
See Nordic power the way
it actually behaves.
No sales call. No enterprise contract. Request a free password and you're in — the whole Nordic system in one place.