Every dataset on one stage — then the forecast.
One workflow, center stage for traders: read the Nordic system today and see exactly what's congesting the network — with spread-risk forecasts on the way.
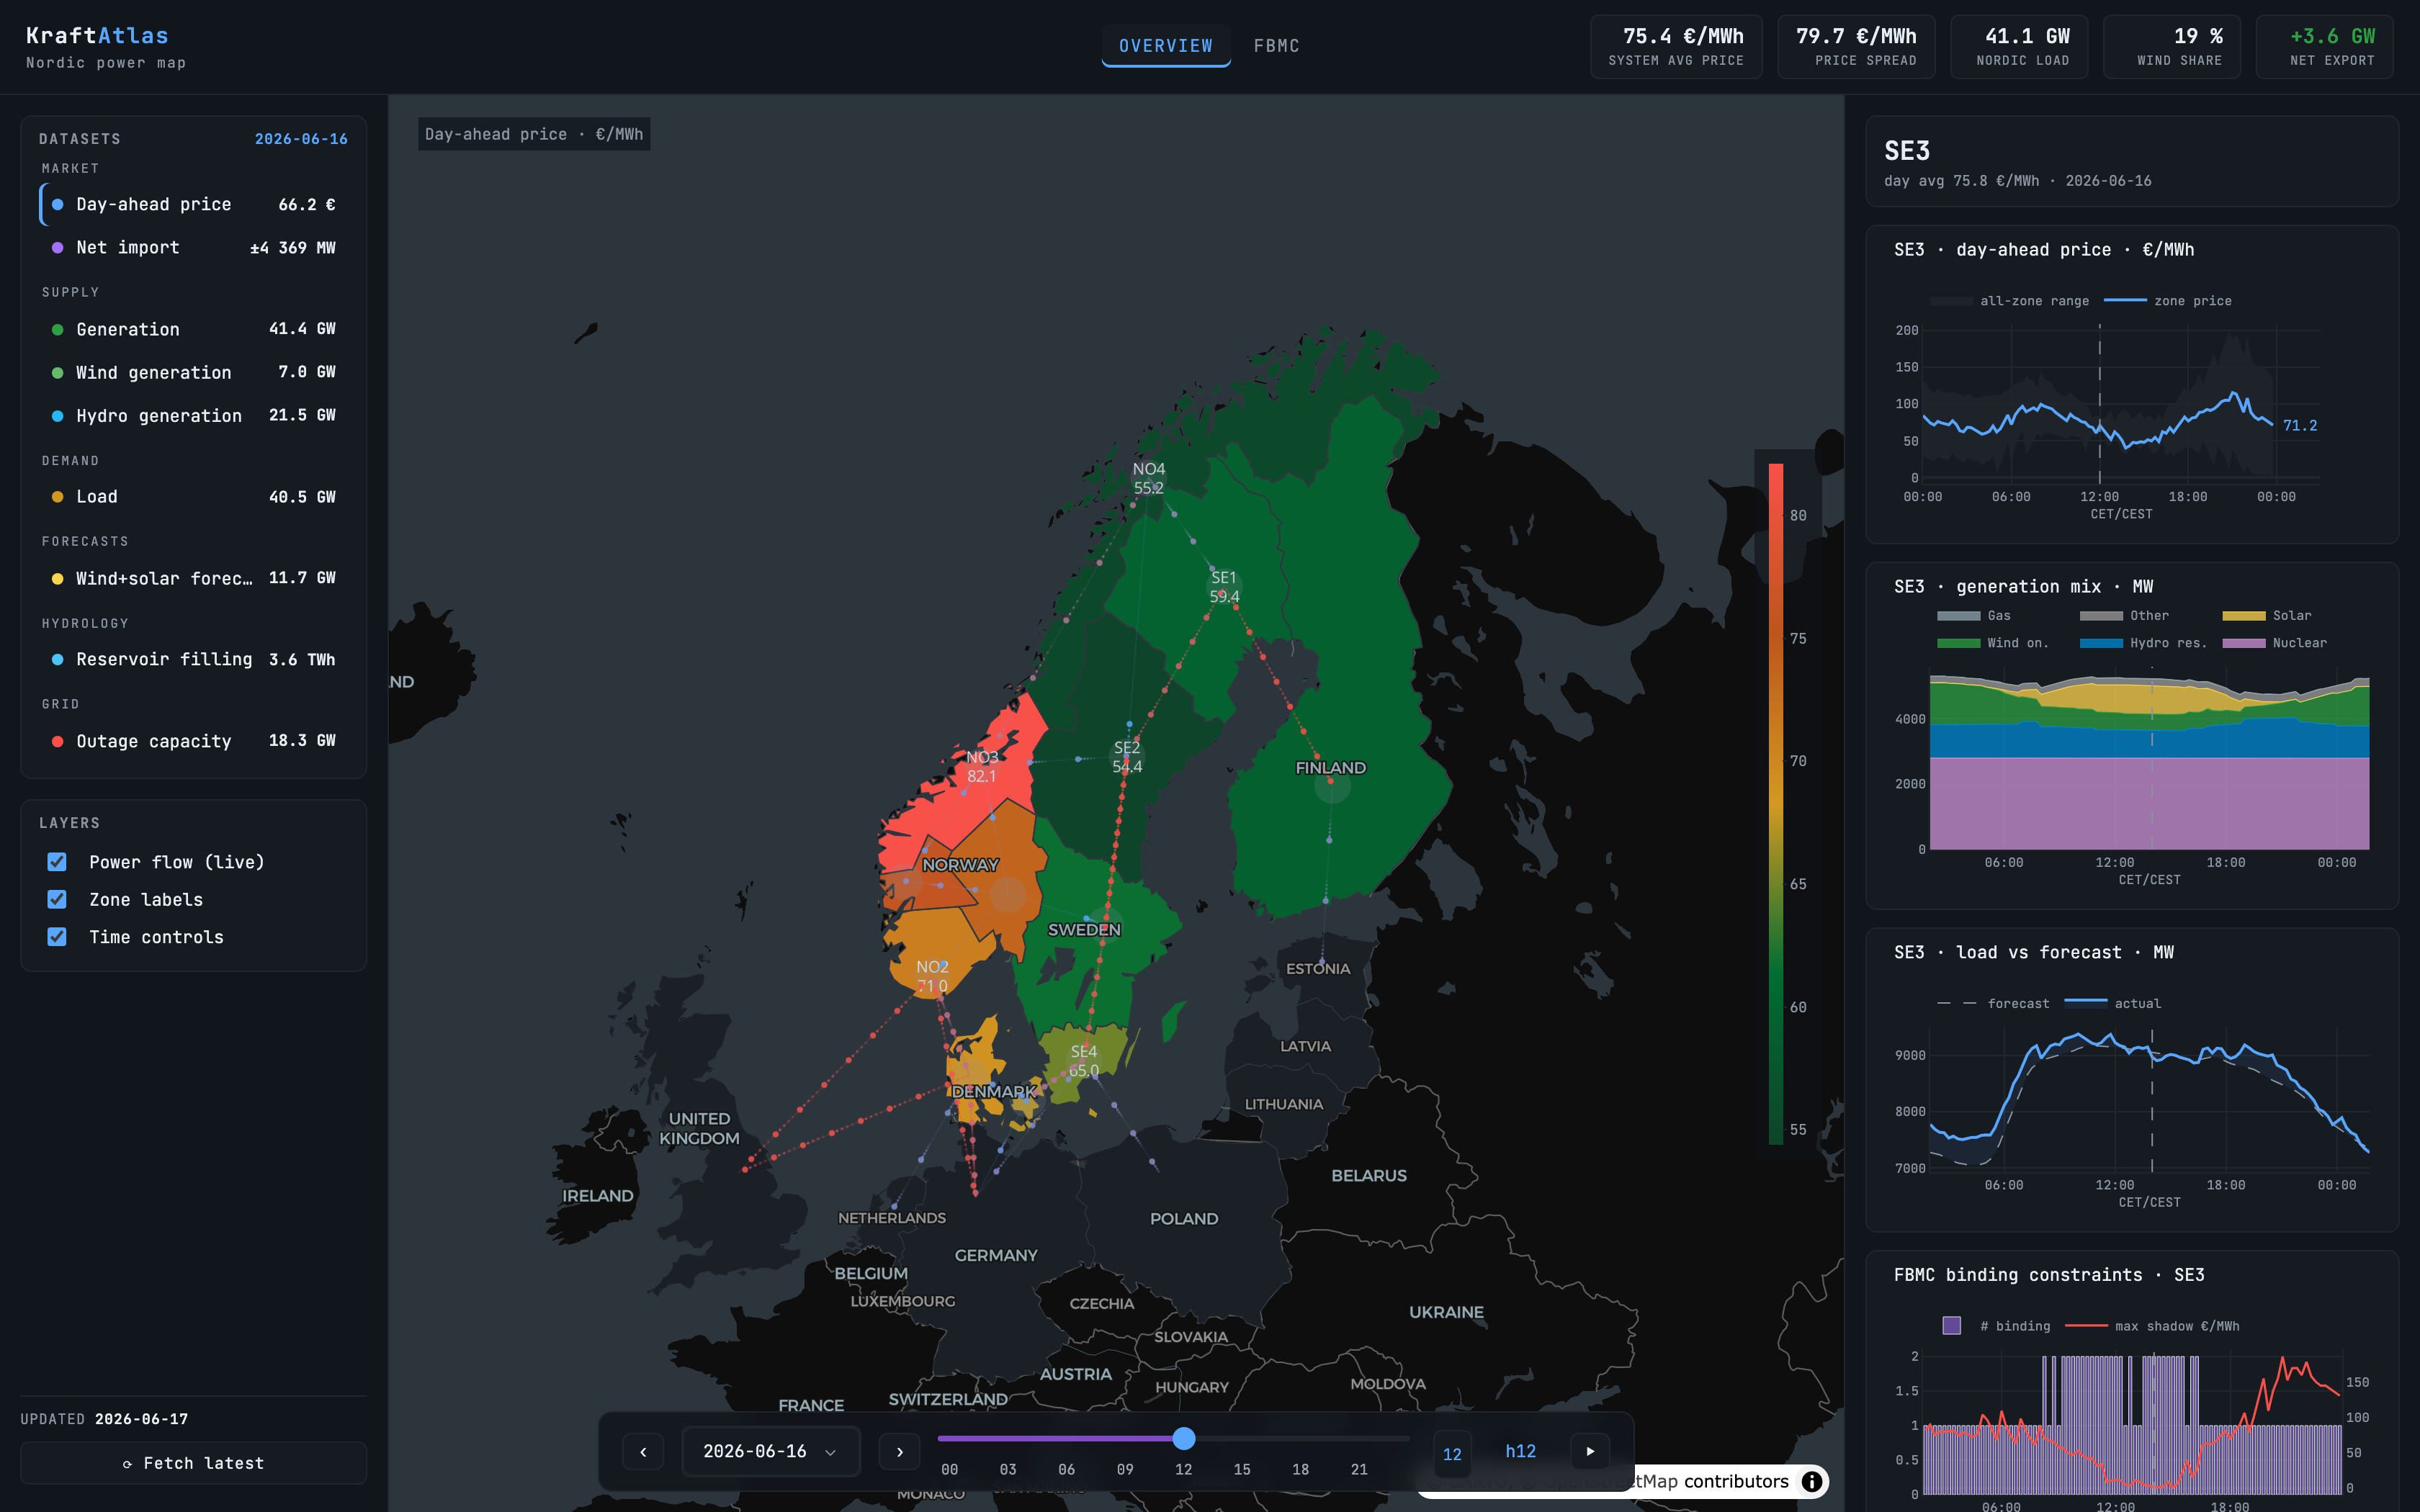
One live map of the whole Nordic system.
Open it and read the situation in seconds: day-ahead prices, generation by source, load vs. forecast, hydro reservoirs, outages and live cross-border flows — every bidding zone, refreshed each morning.
- Choropleth map you can drive by metric — price, net import, wind, hydro, load
- Per-zone detail: price curve, generation mix, load-vs-forecast, FBMC constraints
- Live flow overlay on all 27 interconnectors
- Bloomberg-terminal aesthetic — no login, no sales call
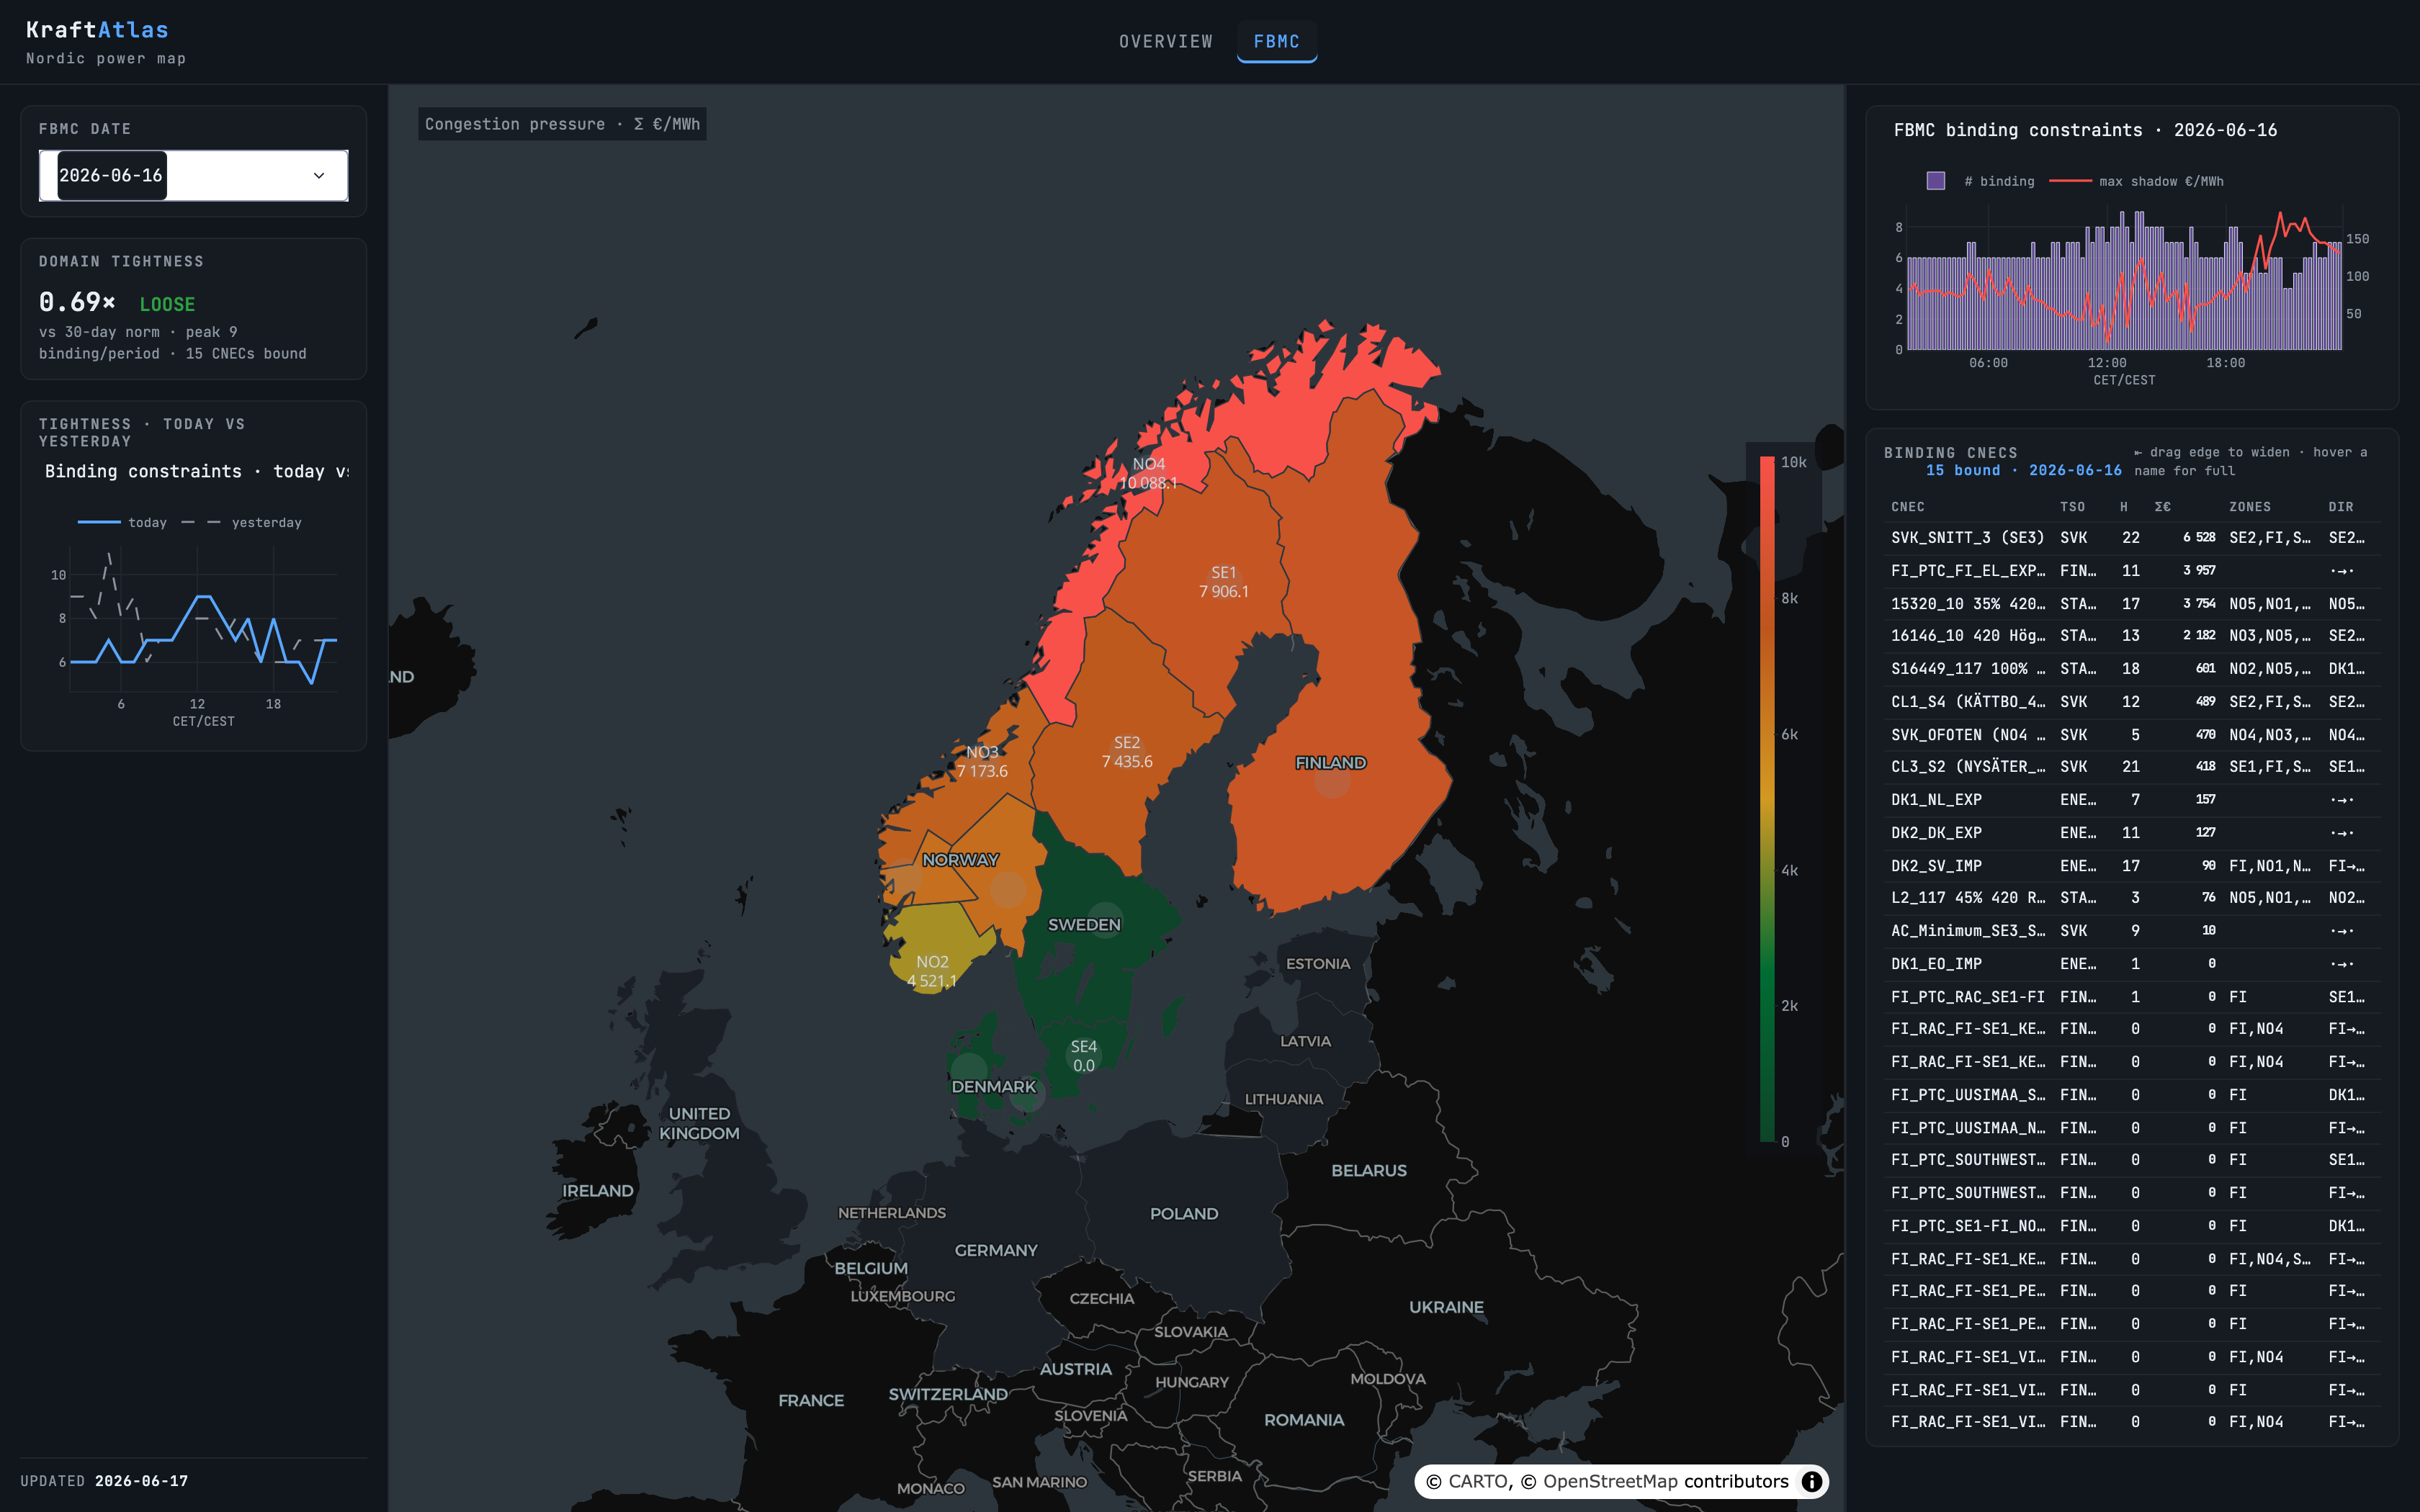
Read what's binding the grid — not just the price.
Kraftatlas parses the flow-based domain into something you can act on: which constraints are binding, how tight the network is versus its norm, and which zones each shadow price is loading on.
- Network-tightness index vs. trailing norm
- Binding-constraint history through the day
- CNEC explorer — sort by shadow price, link the row to the map
- The interpretation layer the raw flow-based data never gives you
Next — forecast the spread you actually trade.
The same flow-based features will feed a leakage-proof model that publishes a probabilistic spread-risk forecast before gate closure, across the spreads that carry the basis. Coming soon.
Quantile fans
Not a single number — a calibrated distribution. Median plus the spread of plausible outcomes for tomorrow's hourly delta.
Tail probabilities
The numbers a desk hedges on: P(spread < −10), P(|spread| > 20). Probabilities, checked against what actually happened.
Public track record
Every forecast timestamped before gate closure and scored in the open. The one asset competitors can't copy faster than real time.
From public data to a live signal.
A simple pipeline, refreshed every morning in the cloud.
Public data
Market and weather data, collected every morning.
One clean dataset
Cleaned and organised into a consistent, ready-to-use form.
The live map
Rendered as one view of the whole Nordic system.
Spread risk Soon
Turned into a calibrated spread-risk forecast.
Launch the live map.
No login. No demo call. The whole Nordic system, in one place — free.